Monthly financial reporting: The reports you need every month
By
Chris Arndt
Quick Links
If you’re only looking at your financials once a quarter (or worse, at year-end) you’re running your business while looking at the rearview mirror. For mid-market businesses in manufacturing, distribution, and ecommerce, think of monthly financial reporting as the difference between being reactive and being in control.
Quarterly reporting feels neat and tidy. It lines up with board meetings and investor updates. But in practice? Waiting three months to spot a problem is like waiting until your factory floor is underwater before calling a plumber.
Monthly reporting allows you to:
Spot issues early. Cash shortages, expense creep, or declining margins don’t sneak up on you.
Course-correct faster. See the problem in May, fix it in June, rather than scrambling in Q4. (Hit us up if this is you; our outsourced controller services can get you cleaned up an on-time before the end of this quarter).
Make better strategic bets. Growth decisions (new product lines, equipment purchases, expansion plans) rely on accurate, timely data.
The 3 Financial Reports You Can’t Afford to Ignore
I’m giving away the answer here. This is the report that is ignored the most, but gives you the most information to make decisions.
1. The Balance Sheet: Your Business’s Vital Signs
Think of the balance sheet as your company’s blood pressure and pulse. It shows what you own (assets), what you owe (liabilities), and what’s left over (equity).
Why it matters monthly: You’ll see if your receivables are ballooning, inventory is tying up too much cash, or debt is creeping up faster than equity.
Without it: You might feel “profitable” but actually be one slow-pay customer away from a cash crunch.
4 metrics you can find on your balance sheet:
Current Ratio
Days Sales Outstanding
Inventory Turnover
Debt-to-Equity Ratio
Your cash flow problem might not be in your P&L. It might be hiding in your balance sheet.
A client recently asked why their cash seemed off, even though their income statement looked solid.
Here’s what I told them:
“The changes in your balance sheet are the story of what’s happening to your cash.”
Accounts receivable up? That’s cash tied up in unpaid invoices. Inventory bloated? That’s cash sitting on shelves. Payables stagnant? That’s cash leaving sooner than it should.
And then there are the black holes. Balance sheet accounts with lingering balances, no backup, and no one sure why they’re still there. If those are wrong, your P&L is wrong.
If your P&L is wrong, your cash decisions probably are too.
2. The Profit & Loss Statement: The Story of Your Business
The P&L (or income statement) tracks revenues, expenses, and profits over time. It answers the classic CEO question: “Did we make money this month?”
Why it matters monthly: It highlights whether revenue growth is sustainable or if expenses are scaling out of control.
Without it: You could celebrate sales growth while burning through cash on the back end.
4 metrics you can calculate from your income statement:
The cash flow statement (or statement of cash flows) reconciles the difference between profit and actual cash in the bank. Spoiler alert: they don’t always match. It measures your operating, investing and financial activities.
Why it matters monthly: It tells you whether your day-to-day operations are generating or draining cash.
Without it: You risk being “profitable on paper” but unable to make payroll.
4 metrics you can calculate from the statement of cash flows:
Operating Cash Flow
Cash Conversion Cycle
Free Cash Flow
Cash Burn Rate
Example of how to use all 3 financial reports
Does this sound familiar?
“The P&L looks good… so where’s all the cash?”
You’re not alone. This is one of the most common (and frustrating) disconnects we see in mid-market companies. That’s why we always walk clients through a simple breakdown of the financial reports:
Your P&L shows your profit. Your balance sheet tells you where the cash went. The statement of cash flows connects the dots between the two.
Start with your net profit from the P&L.
Then look at your balance sheet: every account, from AR to AP to inventory to prepaid expenses.
Measure the dollar change in each account over the month.
Then add or subtract each of those changes from your net profit. The result? Net change in cash.
That’s exactly what a Statement of Cash Flows does.
For example:
If Accounts Receivable goes up, that’s cash not collected. It’s a hit to cash flow.
If Accounts Payable increases, that’s cash not paid yet. That’s actually a short-term win.
If Inventory increases, that’s cash you’ve spent on stock you haven’t sold.
When you track this monthly — not just at year-end — you get real visibility into why your cash is moving, not just how much cash you have.
Let’s say your Profit and Loss statement shows this:
Revenue: $100,000
Expenses: $40,000
Net Profit: $60,000
It looks like you’re ahead by sixty grand. But then you look at your bank balance, and it doesn’t match. It’s only up by $50,000. Where’d the other $10K go?
Check your balance sheet.
In this case, Accounts Receivable went up by $10,000. That means $10K of your sales haven’t been collected in cash yet. You invoiced it, but the cash hasn’t hit your bank account.
So, in this simple example:
You started with $60,000 in net profit
Subtract the $10,000 increase in AR
Your net cash increase is $50,000
That’s the logic behind the indirect method used in a statement of cash flows. You take your profit and adjust for changes in working capital, like AR, AP, inventory, and prepaid expenses, to arrive at your net change in cash.
Financial Report Comparison Table
Here’s a useful table that you can use as a cheat sheet of the key takeaways for the three financial reports and the insights you need from them on a monthly basis:
Report
What It Shows
Key Metrics & Insights
Why Review Monthly
Balance Sheet
A snapshot of what the company owns (assets), owes (liabilities), and retains (equity) at a specific point in time
Reveals whether your operations are generating enough cash to sustain the business.
Check out our cash burn calculator and determine your operational runway while factoring in inventory cash needs. We dive into these metrics regularly with our outsourced CFO services.
Why Outsourcing Helps
Here’s the reality: many mid-market businesses struggle to keep monthly reporting consistent. In-house teams are buried in transactions, and closing the books drags on. That’s where outsourcing comes in.
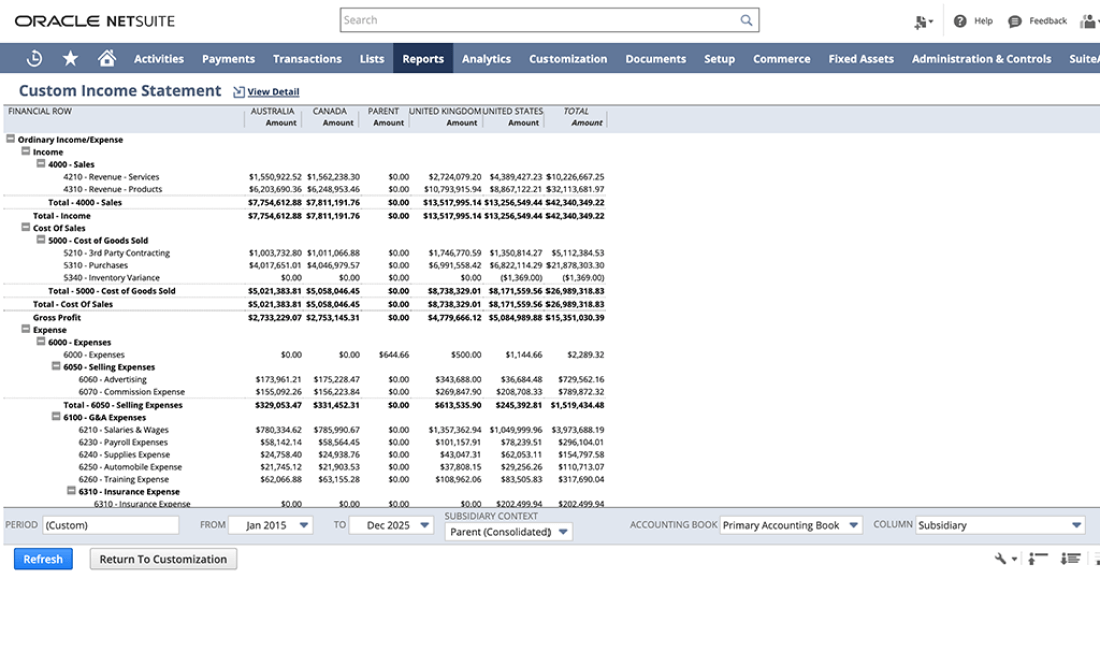
Plus, with the added frustration that comes with trying to build custom reports in NetSuite, having your own, “built-for-you” monthly financial reporting just makes sense.
At expandCFO, we specialize in outsourced accounting services and NetSuite reporting that gives you clean, timely financials, every month, without the headache. In fact, you get all three of these in an interactive format that you can toggle through monthly, YTD, in percentage and dollar amounts to quickly decide what needs seeing to:
Think of monthly reporting like regular checkups with your doctor. Skip them, and you might not notice the problem until it’s too late. Commit to them, and you’ll have the clarity and confidence to run your business with the lights on.
Curious if your reporting cadence is slowing down your growth? Let’s talk. We’ll help you build financial clarity and momentum, one month at a time.